
Google Lighthouse Part 1 Performance Testing
I have had a task to check out performance testing tools hanging out on my todo list for a bit. I did a quick pass through a number of different offerings, and hoped to give the Sauce Labs offering a look after attending SauceCon last year, but we aren’t enterprise customers, so that didn’t happen unfortunately. In the end, I kept getting drawn back to Lighthouse which is a free tool from Google. In their own words:
You give Lighthouse a URL to audit, it runs a series of audits against the page, and then it generates a report on how well the page did. From there, use the failing audits as indicators on how to improve the page.
There’s a number of ways you can run Lighthouse — there’s a web UI, you can run it in Chrome using an extension or you can run it from the command line. The command line option might come in handy in the future if we roll out an automated system for testing and tracking data over time. And there’s a cool way to share Lighthouse Reports using an online viewer and Github gists (you can see the report in it’s entirety that I’m screenshotting here).
One of the things that really got me interested in Lighthouse is that it does more than just performance testing:
It has audits for performance, accessibility, progressive web apps, and more.
In order to keep the length of this post under control however, I’ll focus on just the performance part in this blog post, and then write follow up posts about the different sections later.
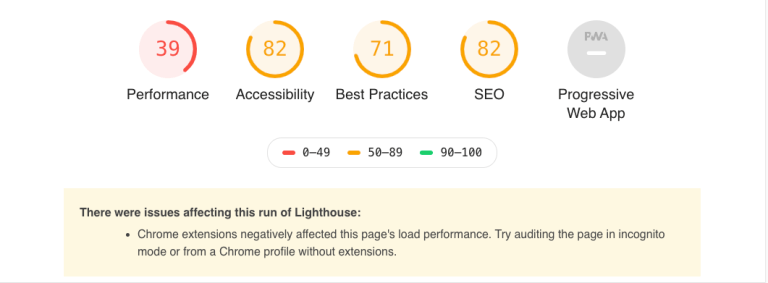
The top part of the report gives you a summary of how things went overall. Everything is a score out of 100 (yikes, we’ll get to the performance score in a second!) . You’ll notice the warning about possible Chrome Extension conflict here — I think that in this case it’s likely warning about the adblocker I run, so I did as suggested and re-ran Lighthouse in Incognito — the results were almost identical (the performance score was slightly lower, but that makes sense because it was making calls to GTM).
Performance Results
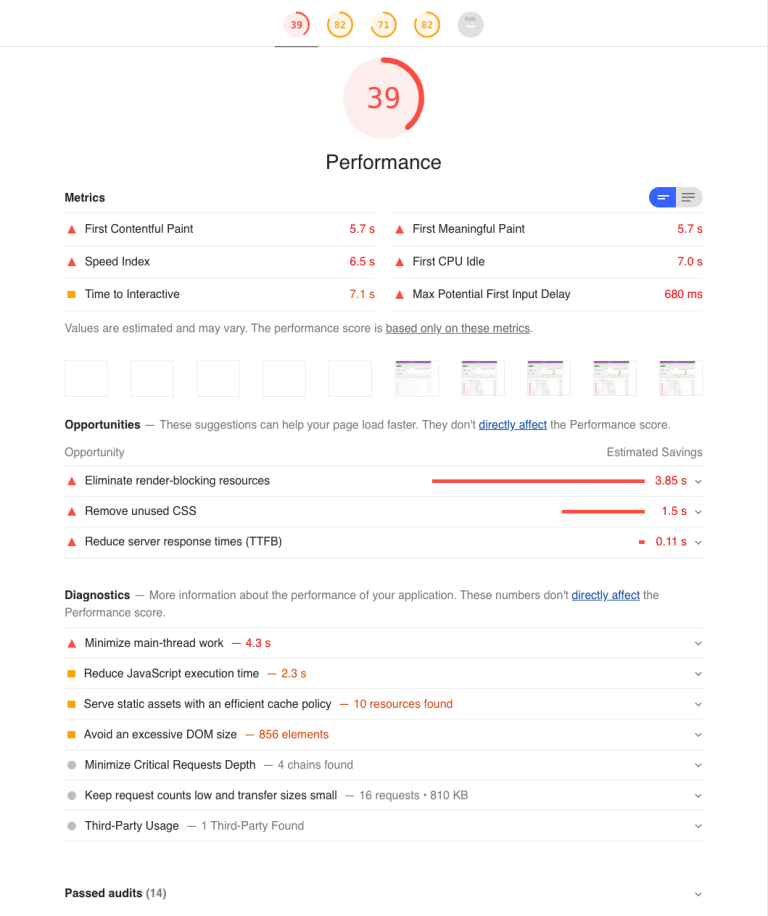
The performance audit is broken down into four sections: Metrics, Opportunities, Diagnostics and Passed audits. Metrics gives us some numbers on how quickly things loaded and were displayed. There’s more to performance than just page load time — performance is really tied to visitor experience. As such, a lot of the numbers displayed here relate to how people see our pages. We didn’t do great in performance according to Lighthouse. For those interested in how the scores are calculated, here’s that information.
First Contentful Paint (FCP)
First contentful paint is the time at which the first text or image is painted (displayed) on the screen. In this case, from the time I clicked on the Invoices link to the time anything was displayed to me was 5.7 seconds. If that was the home page of GetHarvest.com, that would be really poor result, but it’s a pretty data-heavy page within the application so it’s probably okay. That said, Lighthouse is about to give us some suggestions on how to improve it!
First Meaningful Paint (FMP)
Unlike First Contentful Paint, First Meaningful Paint measures how long it takes before the main content of the page is displayed (you can see that both of our scores are the same). You might be scratching your head at this point wondering “what the heck is the difference?” An in-app page probably isn’t the best example for explaining the differences, so instead think about a news story on a popular news website. Those pages are frequently filled with advertising which, frustratingly, always seems to load first. On a page like that, we might might see an ad right away — within say 2 seconds (FCP) but it might take much longer for the news story to load, say 10 seconds (FMP).
In the case of the invoices page, all of the content is being loaded at once. We aren’t displaying (for example) summary information, followed by the bar chart, followed by a list of invoices. It’s all delivered together. We’ll talk about this a bit more under “Opportunities”.
First CPU Idle/Time to Interactive
This is basically a measure of “done” in our case. These metrics are measuring when the page’s main thread has quieted down enough that the page can be interacted with (a search could be performed, one of the invoices could be clicked on). In our case it’s around 7 seconds — which isn’t bad at all because this is a pretty heavy, in-app page.
Opportunities & Diagnostics
The majority of the opportunities identified revolve around removing unused JS and CSS from the page. Lighthouse estimates that we could save 1.5 seconds off our load time by cleaning up our CSS and deferring the loading of styles.
The biggest recommendation is in eliminating render-blocking resources. From the report, our fonts CSS file and our invoices JS file both weigh in at over 200 KB each. We’re requiring those to be fully loaded before we display the contents of the page. According to Lighthouse, there are 3.85 seconds of potential savings to be made in this area.
Under Diagnostics, the picture becomes even clearer. The top recommendation is to minimize main-thread work — it take 1.893 ms to evaluate the JS on the page and an additional 800 ms to process the style and layout of the page. By cutting down the complexity of the page layout, CSS and JS processed, we could see significant savings!
Conclusions
Just because we CAN do these things, don’t mean that I think we SHOULD do these things! I haven’t spent hours in the CSS and JS of the /invoices page or looking at the markup. I recognize that doing the development work on this stuff takes time, and nobody is complaining about the speed of this page anyhow — so why bother? This write-up wasn’t at all a critique of the Invoices page, but was only meant as a way to illustrate what types of information we can get from performance testing and what we can do about those results once we’ve got them!